Workflow Visualization: No More Obscure Business Workflows

Research consistently shows that humans process visual information far more effectively than text. Studies indicate that around 90% of the information processed by the brain is visual, making visual formats significantly easier to understand and retain. In the UK, this is especially relevant as organisations increasingly focus on digital transformation and process efficiency. UK government and industry reports show that businesses adopting visual and digital process tools experience faster decision-making and measurable productivity gains.
Harnessing the natural strength of visual thinking can significantly improve operational performance. A workflow visualiser helps organisations clearly map business processes, align teams around shared goals, identify inefficiencies early, and drive higher productivity. For UK organisations facing increasing pressure to do more with fewer resources, workflow visualisation provides a practical and powerful way to bring structure, transparency, and continuous improvement into everyday operations.
What is a Workflow Visualizer?
A workflow visualizer is a software application that helps you to map out and visualize the different stages of a workflow. It allows you to visualize the entire business process from start to finish, giving you a clear view of the steps that need to be taken and how they all interact with each other. By being able to see the entire process in one place, it’s much easier to make sure that tasks are completed in a timely manner and that all the necessary and appropriate steps are taken.
Why Workflow Visualisation Matters
Workflow visualisation is more than a way to document processes – it is a strategic capability that helps organisations understand, manage, and improve how work gets done. By transforming abstract steps into a clear visual workflow, teams gain visibility into operations, reduce complexity, and align execution with business goals.
Modern organisations operate across multiple departments, systems, and locations. In this environment, visual workflow management becomes essential for maintaining clarity, accountability, and efficiency. According to a UK study by McKinsey, employees spend nearly 20% of their working week searching for information or clarifying processes, highlighting the need for clearer and more visible workflows.
1. Identify Bottlenecks Faster
One of the biggest advantages of workflow visualisation is the ability to quickly identify bottlenecks and inefficiencies. When a workflow is represented visually – through flowcharts, process diagrams, or workflow maps – it becomes immediately clear where work slows down.
Delays caused by unnecessary approvals, duplicated tasks, excessive handovers, or overloaded roles are much easier to detect in a workflow visualisation tool than in text-based documentation. UK organisations that actively map and review processes report up to 30% reductions in process delays, according to research by the Chartered Institute of Management Accountants (CIMA).
This level of visibility enables proactive process optimisation rather than reactive problem-solving.
2. Improve Transparency and Accountability
Workflow visualisation brings transparency to complex processes by clearly defining roles, responsibilities, and task ownership. Each step in a visual workflow shows who is responsible, what action is required, and how the output moves to the next stage.
This clarity reduces confusion, eliminates assumptions, and minimises dependency-related delays. Team members understand how their work fits into the wider process, while managers gain improved oversight without resorting to micromanagement.
Studies from the UK’s Office for National Statistics (ONS) show that unclear responsibilities are a key contributor to workplace inefficiencies, making visual workflow management a practical solution for improving accountability and performance tracking.
3. Enhance Collaboration Across Teams
Visual workflows act as a shared reference point for cross-functional teams. Instead of relying on emails, spreadsheets, or verbal explanations, teams collaborate around a single, visual representation of the process.
This is especially valuable for organisations with distributed, remote, or hybrid teams. According to a 2023 UK workplace report by Deloitte, over 40% of UK employees now work in hybrid arrangements, increasing the need for clear, shared process visibility.
By using workflow visualisation tools, teams reduce miscommunication, align expectations, and coordinate work more effectively – resulting in smoother collaboration and faster execution.
4. Enable Continuous Process Improvement
Workflow visualisation plays a critical role in continuous improvement initiatives. When workflows are visible, they become easier to measure, analyse, and refine over time.
Teams can track key performance indicators such as cycle time, task completion rates, and error points directly against the visual workflow. UK organisations that adopt continuous improvement practices supported by visual process mapping see productivity improvements of 15–25%, according to research by the British Standards Institution (BSI).
Rather than treating workflows as static documentation, visual workflow software turns them into living systems that evolve alongside changing business needs.
5. Support Better and Faster Decision-Making
Clear workflow visuals reduce ambiguity and cognitive overload. Decision-makers can see the entire process at a glance, including dependencies, handovers, and potential risks.
This holistic view enables faster, data-driven decisions – whether reallocating resources, approving changes, or scaling a process. A UK survey by PwC found that organisations with clear process visibility are twice as likely to make timely operational decisions compared to those relying on fragmented documentation.
As organisations grow in scale and complexity, workflow visualisation becomes a powerful decision-support tool that improves operational agility and responsiveness.

How to Visualize Workflows: A Brief Overview
Visualizing workflows can be a great way to improve business operations. By taking the time to create a visual representation of your workflows, you can identify areas of inefficiency and optimize your process for better results.
With the right workflow visualizer, you can improve your operational performance and increase the efficiency of your business. This section explores how and what it involves for a workflow visualizer to make the business operation more seamless and hassle-free.
Figuring out value-added streams
Businesses involve multiple tasks and processes to accomplish their goals and objectives. Some tasks are mandatory for business operations while some additional value to the business drive. Identifying such value-adding factors will reveal many opportunities for improvement that you were unaware of. Visualization of workflows commences with:
- Listing out the tasks, processes, and activities in a workflow.
- Identifying any dependencies or constraints affecting workflow.
- Analyzing how they are linked and how they interact with one another.
Identifying the scope
Every business process has its own scope. Manipulating your role and control over the specified scope will make business process management more easy and simple. Knowing the scope of a particular business process lets you identify the requirements, the right path to proceed, and its impact on business performance. This step also helps you identify the business process that needs to be visualized.
Mapping workflow stages
The workflow visualization then progresses with mapping. Knowing business processes and their corresponding visualizer component is the key to effective workflow visualization. Map the value-added streams with the respective teams or departments involved, mark the handoff points, and the degree of their responsibility or ownership in the scope, using the defined component shapes. This mapping procedure helps break down complex business processes into simpler tasks.
Here is a quick representation of shapes used in workflow visualizers and what they correspond to.
| Oval | ⭖ | Represents the start/end point |
| Rectangle | ▭ | Represents instruction/command |
| Diamond | ◇ | Represents the decision-making block. One path of the block directs to true while the other directs to false. |
| Arrow | → | Represents flow |
| Circle | ⚪ | Represents connector |
| Clock | Represents time delay |
Determining the type and output
The mapped process is usually known for employee engagement but determining the type and their outcome improves the feasibility of the business management process. Differentiating and segregating the tasks based on their type, prerequisites, outcomes, and state facilitate a structured approach in the workflow.
Tracking and review
By tracking the process and reviewing their outcomes periodically, workflow visualizers can help businesses identify potential bottlenecks and make any necessary adjustments in order to meet deadlines. In addition to visualizing workflow, businesses can also use the workflow visualizer to create reports.
These reports can help to provide insights into the performance of the business and its effectiveness. This can be extremely useful for businesses that are looking to improve their operations.
With workflow visualization, businesses can ensure that their workflows are running smoothly and efficiently. A workflow visualizer can be a great asset for any business. Providing an easy way to keep track of workflows, can help to seamless streamlining processes and promote easy business management.
It also improves collaboration between team members ensuring everyone involved is on the same page. If you’re looking for a way to simplify your workflow, a workflow visualizer is definitely worth considering. Furthermore, choosing the right workflow visualization tools can further enhance workflow efficiency, reduce costs and improve productivity.
Core Workflow Visualisation Techniques
Different workflows require different visual approaches. The following techniques form the foundation of effective workflow visualisation.
Flowcharts
Flowcharts are one of the most common ways to visualise workflows. They use standard symbols – such as rectangles for tasks, diamonds for decisions, and arrows for flow direction – to represent sequential steps.
Best for:
Linear and rule-based processes
Approval flows
Simple decision-making workflows
Kanban Boards
Kanban boards visualise work as it moves through stages, typically represented as columns such as “To Do,” “In Progress,” and “Done.” Each task is shown as a card that moves across the board.
Best for:
Ongoing work management
Agile and iterative workflows
Balancing workloads and improving flow
Gantt Charts
Gantt charts focus on time-based workflow visualisation. Tasks are plotted on a timeline to show duration, dependencies, and milestones.
Best for:
Project-based workflows
Deadline-driven initiatives
Tracking dependencies and schedules
Advanced Workflow Visualisation Strategies
As organisations grow and processes become more interconnected, basic flowcharts are often no longer sufficient. Advanced workflow visualisation strategies help teams manage complexity, improve operational clarity, and maintain control across multi-step, cross-functional workflows. By combining the right visual techniques with modern workflow visualisation tools, businesses can gain deeper insights into how work actually flows. This is increasingly relevant in the UK as hybrid working remains widespread – 27% of workers in Great Britain were working in some kind of hybrid arrangement in October 2025 – which increases the need for shared, visual operational clarity across locations. House of Commons Library
1. Value Stream Mapping
Value Stream Mapping (VSM) is a powerful workflow visualisation technique that focuses on identifying which steps in a process add value and which introduce waste. Instead of simply showing task sequences, VSM highlights the flow of information, materials, and time throughout the workflow.
By visualising the entire value stream, teams can pinpoint delays, redundant approvals, unnecessary handoffs, and non-value-added activities. This approach is especially useful for optimising operational workflows, improving cycle time, and supporting continuous improvement initiatives. Value stream maps are often used as a starting point for workflow optimisation before building automated or visual workflows.
2. Swimlane Diagrams
Swimlane diagrams take workflow visualisation a step further by organising tasks into lanes based on roles, teams, departments, or systems. Each lane clearly shows who is responsible for each step, making ownership and accountability explicit.
This type of visual workflow is particularly effective for cross-functional processes such as procurement, onboarding, or incident management, where work moves between multiple stakeholders. By clearly visualising handoffs and dependencies, swimlane diagrams reduce confusion, prevent delays, and improve coordination across departments.
3. Clarity Over Complexity
One of the most important principles of effective workflow visualisation is prioritising clarity over complexity. Overly detailed diagrams can overwhelm users and reduce adoption. Instead, complex workflows should be broken into layered or modular views.
High-level workflow visuals provide leadership with an overview of the entire process, while detailed visual workflow maps support execution teams with task-level clarity. This approach ensures that each stakeholder sees the level of detail they need without losing sight of the overall workflow structure.
4. Interactive and Real-Time Visuals
Modern workflow visualisation tools go beyond static images and diagrams. Interactive and real-time visuals allow users to explore workflows dynamically, click into individual tasks, and view live status updates as work progresses.
These advanced workflow visualisation tools integrate directly with underlying systems, enabling real-time tracking, performance monitoring, and data-driven decision-making. Interactive visuals transform workflow images into living process maps that evolve with the business, making visual workflow management more effective and actionable.
How to Build a Visual Workflow Step by Step
Creating an effective workflow visualisation requires more than drawing boxes and arrows. A well-designed visual workflow provides clarity, improves process efficiency, and serves as a foundation for workflow management and automation. The steps below outline a structured approach to building clear, scalable, and actionable workflow visuals.
1. Define Scope and Objectives
Start by clearly defining the scope of the workflow. Identify where the workflow begins, where it ends, and what triggers it. Establish the primary goal of the process—whether it is improving turnaround time, reducing errors, enhancing collaboration, or standardising approvals.
Clarifying objectives early ensures the workflow visualisation tool reflects business priorities rather than unnecessary detail. A focused scope also prevents workflow diagrams from becoming overly complex or difficult to maintain.
2. Break Down the Workflow
Decompose the workflow into manageable components using a simple and effective structure:
Input: Requests, data, documents, or resources that initiate the workflow
Process: The actions, tasks, and decisions that transform the input
Output: The final deliverable or completed outcome
This structure helps teams understand how information and tasks move through the system. It also makes it easier to identify redundancies, dependencies, and missing steps during workflow mapping.
Breaking workflows into inputs, processes, and outputs ensures the workflow visual is logical, consistent, and aligned with real operational flow.
3. Map the Workflow Steps
Once the workflow is broken down, visually map each step in sequence. Use standard workflow symbols such as rectangles for tasks, diamonds for decision points, and arrows to indicate flow direction. Clearly represent approvals, parallel activities, and exception paths.
This step transforms abstract processes into a visual workflow diagram that is easy to interpret at a glance. Well-mapped workflows reduce ambiguity and allow stakeholders to quickly understand how work progresses from start to finish.
When applicable, include conditional logic to show how different outcomes affect the flow of work, improving the accuracy of the workflow visualisation.
4. Assign Roles and Responsibilities
Every task in the workflow should have a clearly defined owner. Assigning roles ensures accountability and prevents delays caused by unclear ownership. Whether the workflow spans a single team or multiple departments, role clarity is essential for effective visual workflow management.
Including roles directly in the workflow visualisation – such as through swimlane diagrams or labels – helps teams understand handoffs and responsibilities. This is especially important for cross-functional workflows where tasks move between teams or systems.
5. Review, Refine, and Validate
A visual workflow should be reviewed and validated by the people who execute it daily. Walk through the workflow step by step to confirm accuracy, identify unnecessary approvals, and eliminate redundant tasks.
Refining the workflow ensures it remains practical, efficient, and aligned with real-world operations. As processes evolve, workflow visuals should be updated to reflect changes in business rules, systems, or team structures.
Regular validation keeps the workflow visualisation relevant, actionable, and effective as a long-term process improvement tool.
Benefits of Workflow Visualization
Managing business processes is all about knowing the tasks and effectively communicating with the team about the process and its deliverables. Workflow visualizer simplifies this key business management aspect and prevents deviations from the business goal via visuals. Though workflow visualizer creates a visual representation of how business processes work and what is done in every stage of the process, its benefits are more diverse.
1. Improved Productivity
Workflows are an essential part of any business operation. Using visualization tools can make users utilize the workflow elements effortlessly without any tech barriers. Visualizing workflows can be a powerful way to improve business productivity. It also helps to enhance efficiency, reduce waste, and ensure high-quality outcomes.
Workflow visualization tools create insights into your workflows. This can help to identify trends, identify areas of waste, and help to develop strategies for improving the overall performance of your business operations.
2. Enhanced Collaboration
The workflow visualizer allows you to collaborate with other team members. By being able to visualize your workflow, you can better understand the relationships between tasks and processes, which can help you make more informed decisions and optimize your workflow. Listing out the tasks and requirements can positively boost internal communication and collaboration.
3. Effective Elimination Of Bottlenecks
With a workflow visualizer, you can create a map of all the tasks and processes involved in the project, making it easier to figure out the challenges and bottlenecks. Visualizing workflows can help you identify and eliminate redundancies, identify areas of inefficiency, and optimize your process for better results.
It can also help to identify areas that need improvement and help you develop better strategies for improving the overall performance of your business operations.
4. Consistent Improvement
A workflow visualizer helps to identify areas of complexity and pinpoint areas where improvements can be made. In addition to its organizational benefits, workflow visualizer also provides insights into how your workflow is performing. Reports about which tasks are taking the longest and which processes are the most efficient help to analyze the performance of individual team members too.
Workflow visualization is also used for tracking dependencies and ensuring that each task is completed on time. This can be an effective way to monitor progress and identify areas where tasks can be improved or streamlined consistently.
5. Increased Transparency
A workflow visualizer accomplishes process mapping to offer higher transparency. This makes it easy to understand your business progress and helps you make better decisions. You can share the workflow map with your team to ensure that everyone is on the same page and working towards the same goal.
This can help speed up the completion of projects and ensure that everyone is working with informed knowledge of their roles and their impact on the business’s bottom line. Analyzing every step of the workflow can ease identifying the bottlenecks and eradicating the inefficiencies at that stage itself. Such decisions rescue you from losing time, resources, and effort.
6. Easy Alignment Of Priorities
Workflow visualizer helps you organize your business process workflows in an intuitive, easy-to-understand manner. This helps you get a detailed overview of how tasks are connected and determines the most effective flow of activities. Better process alignment by workflow visualizer promotes making better decisions and ensures that your critical projects (high-priority tasks) are completed on time and within budget.
Figuring out the most and least priorities and working accordingly can help businesses ensure operational excellence in the long run. This makes it ideal for businesses that need to streamline their operations and make data-driven decisions.
How to Use A Workflow Visualization Tool to Improve Business Efficiency
As businesses of all sizes continue to search for ways to maximize efficiency and productivity, workflow visualization tools are becoming increasingly popular. These tools are designed to help organizations visualize their workflows, making it easier to identify inefficiencies and other opportunities for improvement.
Interactive data visualization of operational processes can be an enabler in overcoming organizational resistance to big data technologies in a change-resistant organization, claims a study on workflow visualization techniques.
Workflow visualizers are becoming increasingly popular as a way to map out and visualize processes. The best way to visualize workflow commences only when you have a better understanding of the components of a business process and when to use a workflow visualization tool. Knowing the components of workflow visualization tools can help you to create detailed diagrams of these business processes.
Workflow visualizers also show how tasks are related, what tasks depend on each other, and how resources are used. So, using a workflow visualizer before automating a process will be more beneficial, as there is a chance of identifying the inefficiencies at the right time and taking appropriate measures at the right time. Thus, a workflow visualizer emerges to be a great way to understand the flow of work and identify areas of improvement.
When to Use A Workflow Visualization Tool?
Workflow visualization tools are particularly useful for businesses that have complex processes or multiple departments that need to collaborate on tasks. Visualizing workflows can be a great way to make complex processes easier to understand and execute. By breaking down the steps of a workflow into visual components, users can better comprehend the entire process.
This can be especially useful in the workplace, where employees can quickly identify tasks and responsibilities. By creating a visual representation of the workflow, your teams can understand exactly how tasks are related, what tasks depend on each other, and how resources are used.
This can give them a clear idea of what needs to be done and when – allowing them to identify any bottlenecks or inefficiencies in the process. As such, a workflow visualizer can be an invaluable tool for businesses looking to streamline their operations.
Why an Effective Workflow Visualization Tool is Essential?
Workflow visualizers also provide an easy way to track progress and make sure that tasks are completed in the right order. By being able to quickly view the workflow and make sure that each step is completed successfully, you can make sure that the entire workflow is completed correctly and efficiently.
This can be especially helpful when dealing with large and complex workflows, as it can be difficult to keep track of every step manually. Thus, a workflow visualizer is the best way to visualize workflow and improve the efficiency of any business. By using it, businesses can identify potential issues and make improvements to their operations.
It is a great tool for streamlining processes, making data-driven decisions, and providing valuable insights into business performance.
Workflow Visualizer – Real Time Examples:
With an effective workflow visualizer organizations can maximize efficiency and streamline complex processes. Flowcharts, Gantt charts, UML diagrams, business process modeling notation, data flow diagrams, Kanban boards, workflow techniques, and simulation models are just a few of the workflow visualization tools that can be used to represent workflows graphically.
By using these tools, users can quickly identify tasks and understand the entire workflow. In the end, visualizing workflows can be a great way to make complex processes easier to understand and execute. Here are a few real-time instances that make use of workflow visualizers for their business processes.
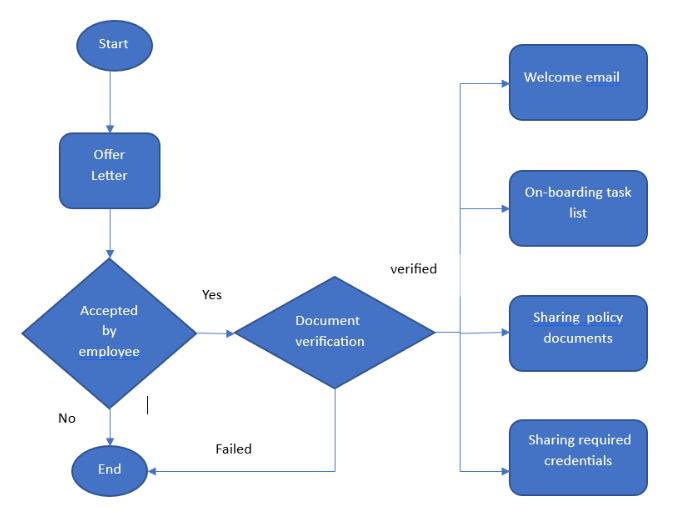
1. Human Resources
The common use of workflow visualization in human resource activity will be for employee onboarding workflow and below is the sample visualization.
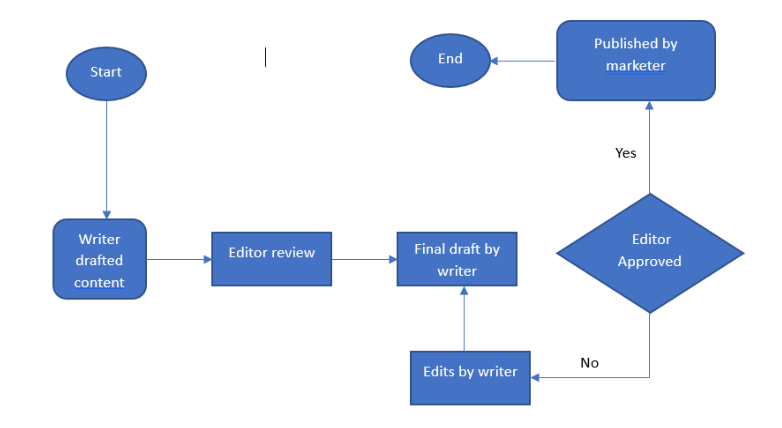
2. Content Marketing
Content marketing involves more coordinated and aligned efforts from the writing, editing, designing, and marketing departments. A workflow visualizer can be a godsend to such workflows and here is a glimpse.
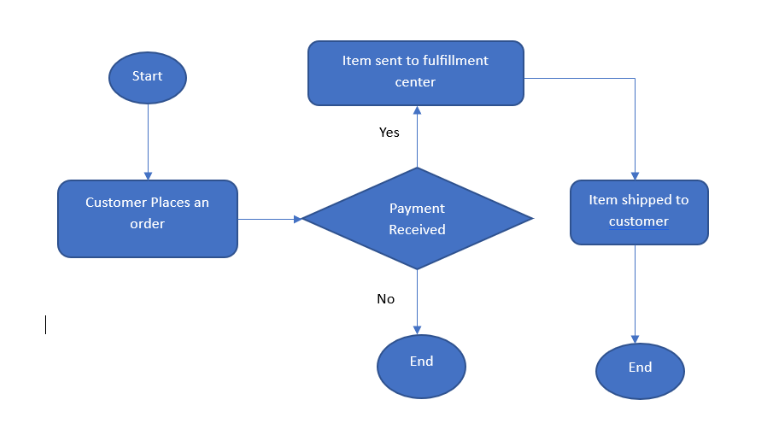
3. Procurement
Every business involves laborious procurement. Workflow visualization aids in making this process chaos-free and easy. A workflow in an e-commerce platform involves a visualization as shown below.
Let the Visuals Communicate Your Business Workflow Clearly!
Workflow visualization tools allow an organization to get an accurate picture of its workflow processes and opting for the right tool drives you through business excellence. Invest in a workflow solution like Cflow which facilitates a visual workflow builder to experience smooth workflow visualization. It is like a feather on your cap, as you can streamline business and Cflow’s visual workflow builder takes care of the workflow visualization part.
Get an obvious visualization of your business workflows with Cflow. Sign up now.
What should you do next?
Thanks for reading till the end. Here are 3 ways we can help you automate your business:

Do better workflow automation with Cflow
Create workflows with multiple steps, parallel reviewals. auto approvals, public forms, etc. to save time and cost.

Talk to a workflow expert
Get a 30-min. free consultation with our Workflow expert to optimize your daily tasks.

Get smarter with our workflow resources
Explore our workflow automation blogs, ebooks, and other resources to master workflow automation.